


Table of Contents
What Is a Merit Matrix?
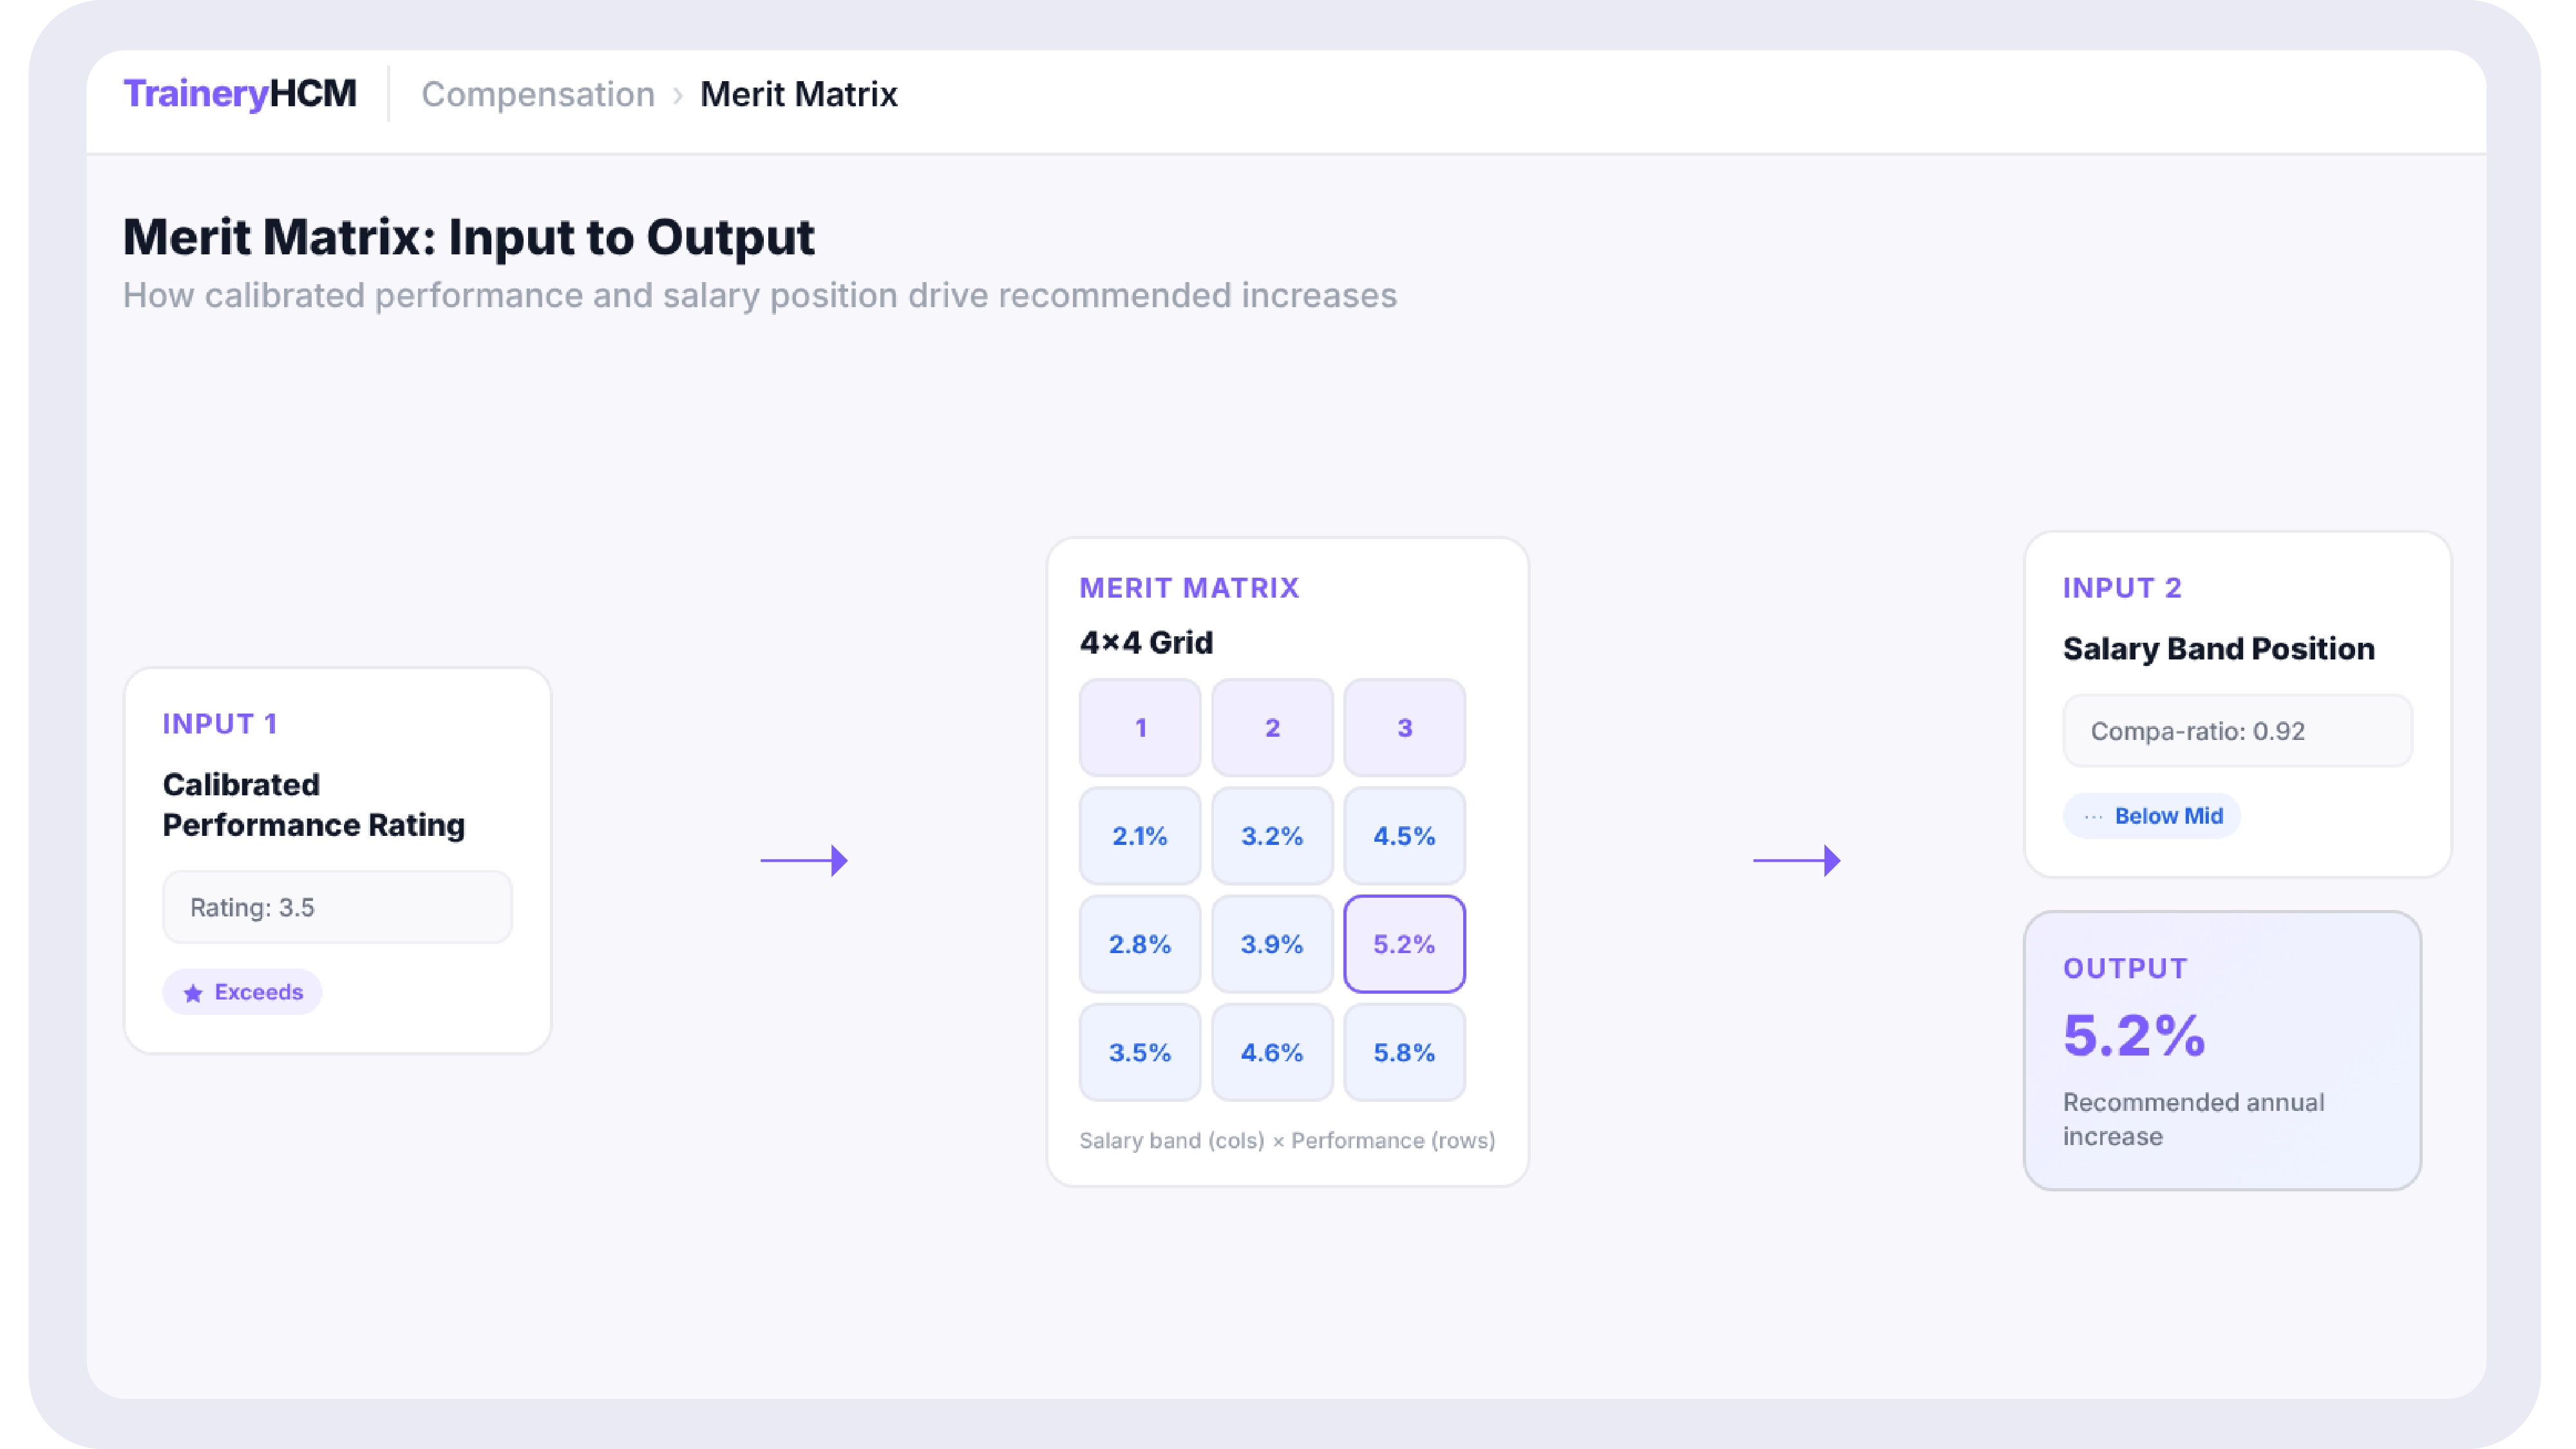
A merit matrix is a grid used during a compensation review to recommend how much each employee's base pay should increase. It maps two inputs against each other: the employee's performance rating on one axis and their position in their salary band, usually expressed as a compa-ratio, on the other. Each cell contains a recommended percentage increase. Strong performers who are paid below their band midpoint receive the largest increases because they are both high contributors and underpaid relative to the market. The matrix exists to ensure pay increases are consistent, performance-driven, and equitable across the entire organization within a fixed budget.
A compensation review asks managers to do three difficult things at once: reward strong performance, stay competitive with the market, and protect pay equity, all on a fixed budget. Without a shared framework, the results drift. One manager is generous, another is conservative, and high performers who happen to be underpaid fall further behind peers doing the same work.
A merit matrix is the framework that holds those three goals together. It removes guesswork from the single hardest question in the cycle: how much should this person's pay increase, and why?
Most guides stop at drawing the grid. That is the easy part. The harder truth is that a merit matrix is only as fair as the two numbers you feed into it. If performance ratings are inconsistent or salary bands are out of date, a beautifully designed matrix will simply distribute unfairness more efficiently. This guide shows you how to build the matrix and how to keep its inputs trustworthy, which is where most cycles quietly fail.
Why a Merit Matrix Matters
Two employees can do equal work and still end up at different salaries, through different starting offers, different tenure, or years of small, inconsistent increases. A flat percentage raise applied to both preserves that gap. Applied year after year, it widens it.
A merit matrix corrects this by factoring in band position. An employee paid below their midpoint receives a larger increase than a peer at the top of the band with the same rating. Performance is still rewarded, but the increase also pulls underpaid employees toward where the market says they should be. Over a few cycles, this is one of the most effective tools for closing unintended pay gaps without a separate remediation project.
It also makes the cycle defensible. When a manager or an employee asks why an increase was a certain size, the answer is a documented combination of performance and pay position, not a manager's discretion. In an era of expanding pay transparency requirements, that documentation matters.
The Two Inputs Every Merit Matrix Depends On
Before you draw a single cell, understand the two numbers the matrix runs on. Get these wrong, and nothing downstream can be right.
Input 1: Performance rating
This is a standardized score, often on a 1 to 5 scale, applied consistently across the organization. The critical word is consistently. If one manager's 4 means what another manager's 3 means, the matrix amplifies that inconsistency into real pay differences.
This is why a calibrated performance review process is a prerequisite, not a nice-to-have. Calibration is the cross-manager session where ratings are normalized so that a 4 means the same thing in every team. A merit matrix applied on top of uncalibrated ratings does not produce fairness. It produces the appearance of fairness on top of inconsistent inputs, which is harder to detect and harder to fix.
Input 2: Salary band position
This measures where an employee's current pay sits within their salary band, usually as a compa-ratio. A compa-ratio of 1.0 means the employee is paid exactly at the midpoint of their band. 0.8 means they sit at 80% of the midpoint, below the market target. 1.2 means they are 20% above it.
Band position is only meaningful if the band itself is current. If your midpoints were last refreshed two years ago, a compa-ratio of 1.0 might actually be well below today's market. Refresh your salary bands against recent benchmarks before you build the matrix, so that band position reflects both internal equity and real market position in a single number.
The dependency competitors skip.
Both inputs come from outside the matrix. Performance ratings come from your review and calibration process. Band position comes from your benchmarking and salary band structure. When these live in separate systems from your compensation planning, they arrive through manual exports, often a cycle out of date. The matrix then runs on stale data. Keeping both inputs live and connected is the difference between a matrix that corrects pay gaps and one that quietly preserves them.
How to Build a Merit Matrix: A Step-by-Step Process
Step 1: Confirm your foundations are ready
Before building anything, verify three foundations exist: a calibrated performance rating scale applied consistently, salary bands refreshed against current market benchmarks, and a clear compensation philosophy that states how strongly pay should follow performance. If any of these are missing, fix them first. The matrix cannot compensate for a weak foundation.
Step 2: Choose your axes and scale
Put performance rating across the top and band position, in compa-ratio bands, down the side. A common structure uses a 1 to 5 rating scale and compa-ratio rows from 0.8 to 1.2 in increments of 0.1. This produces a readable grid that most managers can interpret without training.
Step 3: Set the increase logic
Fill each cell with a recommended increase percentage following one consistent rule: increases rise as performance rises, and increases rise as band position falls. The largest increase belongs in the cell where high performance meets low band position. The smallest, often zero, belongs where low performance meets high band position. Every other cell follows the same gradient.
Step 4: Build the grid
Below is an illustrative merit matrix using a 1 to 5 rating scale, compa-ratios from 0.8 to 1.2, and a maximum increase of 14%. Treat the percentages as an example structure to adapt, not a recommendation, since your numbers depend on your budget and philosophy.
Step 5: Run a real-population test against the budget
Apply the percentages to your actual employee data and total the cost. Compare it to your merit budget. The first version rarely lands on budget, so adjust the cell percentages and re-run until the total fits. Doing this before communicating anything is far easier than walking back later.
Step 6: Communicate the logic to managers
Managers execute the matrix, so they need to understand it. Explain why a strong performer below the midpoint receives more than an equally strong performer above the midpoint. When managers understand that band position is doing equity work, they stop seeing the matrix as a constraint and start seeing it as a cover for fair decisions.
A Worked Example: Same Rating, Different Increase
Take two employees, both rated 4 out of 5 in a calibrated review.
- Employee A has a compa-ratio of 0.9, paid below their band midpoint. The matrix recommends a 9% increase. Strong performance is rewarded, and the larger increase begins closing the gap to the market midpoint.
- Employee B has a compa-ratio of 1.1, already paid above the midpoint. Same rating, but the matrix recommends a 5% increase. Their performance is still rewarded, while the smaller increase reflects that their pay is already competitive.
Same performance, different increase, and both decisions are defensible. That is the matrix doing exactly what it is designed to do: reward contribution while moving the whole population toward equitable, market-aligned pay.
When a Merit Matrix Is Not the Right Tool
A merit matrix is not the only way to allocate increases, and it is not always the best fit. Knowing the alternatives helps you confirm the matrix is right for you.
The 9-box grid is worth noting because it points toward where compensation is heading. By adding potential alongside performance and pay position, it connects pay decisions to development and succession. That only works when performance, learning, and compensation data sit together, which is the same connected-data requirement that makes any merit matrix trustworthy in the first place.
Common Merit Matrix Mistakes to Avoid
- Building on uncalibrated ratings. The most common and most damaging error. Calibrate first, always.
- Using stale salary bands. Band position only means something if the band reflects current market rates.
- Skipping the budget test. Always model the matrix against your real population before committing.
- Leaving managers in the dark. A matrix that the managers do not understand becomes a matrix they override.

Bringing It Together
A merit matrix is one of the most effective tools available for making pay increases fair, consistent, and defensible. But the grid itself is the simplest part. Its value depends entirely on the quality of its two inputs: calibrated performance ratings and current salary band position.
Build the matrix carefully, test it against your real population and budget, and communicate the logic to the managers who will use it. Most importantly, treat the inputs as seriously as the grid. When ratings are calibrated and bands are current, a merit matrix corrects pay gaps while rewarding performance. When they are not, it simply distributes the existing inconsistency faster. The organizations that get this right are the ones that keep performance, compensation, and the data behind both in one connected place.
KEY TAKEAWAYS
- A merit matrix combines two inputs, an employee's performance rating and their position in their salary band, to recommend a consistent, fair pay increase.
- The grid is the easy part. The matrix only works if both inputs are trustworthy: ratings must be calibrated, and salary bands must be current.
- Employees below their band midpoint with strong performance should receive the largest increases, which corrects pay gaps while rewarding contribution.
- Test the matrix against your real population and budget before you commit, then communicate the logic clearly to managers.
What Is a Merit Matrix?
A merit matrix is a grid used during a compensation review to recommend how much each employee's base pay should increase. It maps two inputs against each other: the employee's performance rating on one axis and their position in their salary band, usually expressed as a compa-ratio, on the other. Each cell contains a recommended percentage increase. Strong performers who are paid below their band midpoint receive the largest increases because they are both high contributors and underpaid relative to the market. The matrix exists to ensure pay increases are consistent, performance-driven, and equitable across the entire organization within a fixed budget.
A compensation review asks managers to do three difficult things at once: reward strong performance, stay competitive with the market, and protect pay equity, all on a fixed budget. Without a shared framework, the results drift. One manager is generous, another is conservative, and high performers who happen to be underpaid fall further behind peers doing the same work.
A merit matrix is the framework that holds those three goals together. It removes guesswork from the single hardest question in the cycle: how much should this person's pay increase, and why?
Most guides stop at drawing the grid. That is the easy part. The harder truth is that a merit matrix is only as fair as the two numbers you feed into it. If performance ratings are inconsistent or salary bands are out of date, a beautifully designed matrix will simply distribute unfairness more efficiently. This guide shows you how to build the matrix and how to keep its inputs trustworthy, which is where most cycles quietly fail.
Why a Merit Matrix Matters
Two employees can do equal work and still end up at different salaries, through different starting offers, different tenure, or years of small, inconsistent increases. A flat percentage raise applied to both preserves that gap. Applied year after year, it widens it.
A merit matrix corrects this by factoring in band position. An employee paid below their midpoint receives a larger increase than a peer at the top of the band with the same rating. Performance is still rewarded, but the increase also pulls underpaid employees toward where the market says they should be. Over a few cycles, this is one of the most effective tools for closing unintended pay gaps without a separate remediation project.
It also makes the cycle defensible. When a manager or an employee asks why an increase was a certain size, the answer is a documented combination of performance and pay position, not a manager's discretion. In an era of expanding pay transparency requirements, that documentation matters.
The Two Inputs Every Merit Matrix Depends On
Before you draw a single cell, understand the two numbers the matrix runs on. Get these wrong, and nothing downstream can be right.
Input 1: Performance rating
This is a standardized score, often on a 1 to 5 scale, applied consistently across the organization. The critical word is consistently. If one manager's 4 means what another manager's 3 means, the matrix amplifies that inconsistency into real pay differences.
This is why a calibrated performance review process is a prerequisite, not a nice-to-have. Calibration is the cross-manager session where ratings are normalized so that a 4 means the same thing in every team. A merit matrix applied on top of uncalibrated ratings does not produce fairness. It produces the appearance of fairness on top of inconsistent inputs, which is harder to detect and harder to fix.
Input 2: Salary band position
This measures where an employee's current pay sits within their salary band, usually as a compa-ratio. A compa-ratio of 1.0 means the employee is paid exactly at the midpoint of their band. 0.8 means they sit at 80% of the midpoint, below the market target. 1.2 means they are 20% above it.
Band position is only meaningful if the band itself is current. If your midpoints were last refreshed two years ago, a compa-ratio of 1.0 might actually be well below today's market. Refresh your salary bands against recent benchmarks before you build the matrix, so that band position reflects both internal equity and real market position in a single number.
The dependency competitors skip.
Both inputs come from outside the matrix. Performance ratings come from your review and calibration process. Band position comes from your benchmarking and salary band structure. When these live in separate systems from your compensation planning, they arrive through manual exports, often a cycle out of date. The matrix then runs on stale data. Keeping both inputs live and connected is the difference between a matrix that corrects pay gaps and one that quietly preserves them.
How to Build a Merit Matrix: A Step-by-Step Process
Step 1: Confirm your foundations are ready
Before building anything, verify three foundations exist: a calibrated performance rating scale applied consistently, salary bands refreshed against current market benchmarks, and a clear compensation philosophy that states how strongly pay should follow performance. If any of these are missing, fix them first. The matrix cannot compensate for a weak foundation.
Step 2: Choose your axes and scale
Put performance rating across the top and band position, in compa-ratio bands, down the side. A common structure uses a 1 to 5 rating scale and compa-ratio rows from 0.8 to 1.2 in increments of 0.1. This produces a readable grid that most managers can interpret without training.
Step 3: Set the increase logic
Fill each cell with a recommended increase percentage following one consistent rule: increases rise as performance rises, and increases rise as band position falls. The largest increase belongs in the cell where high performance meets low band position. The smallest, often zero, belongs where low performance meets high band position. Every other cell follows the same gradient.
Step 4: Build the grid
Below is an illustrative merit matrix using a 1 to 5 rating scale, compa-ratios from 0.8 to 1.2, and a maximum increase of 14%. Treat the percentages as an example structure to adapt, not a recommendation, since your numbers depend on your budget and philosophy.
Step 5: Run a real-population test against the budget
Apply the percentages to your actual employee data and total the cost. Compare it to your merit budget. The first version rarely lands on budget, so adjust the cell percentages and re-run until the total fits. Doing this before communicating anything is far easier than walking back later.
Step 6: Communicate the logic to managers
Managers execute the matrix, so they need to understand it. Explain why a strong performer below the midpoint receives more than an equally strong performer above the midpoint. When managers understand that band position is doing equity work, they stop seeing the matrix as a constraint and start seeing it as a cover for fair decisions.
A Worked Example: Same Rating, Different Increase
Take two employees, both rated 4 out of 5 in a calibrated review.
- Employee A has a compa-ratio of 0.9, paid below their band midpoint. The matrix recommends a 9% increase. Strong performance is rewarded, and the larger increase begins closing the gap to the market midpoint.
- Employee B has a compa-ratio of 1.1, already paid above the midpoint. Same rating, but the matrix recommends a 5% increase. Their performance is still rewarded, while the smaller increase reflects that their pay is already competitive.
Same performance, different increase, and both decisions are defensible. That is the matrix doing exactly what it is designed to do: reward contribution while moving the whole population toward equitable, market-aligned pay.
When a Merit Matrix Is Not the Right Tool
A merit matrix is not the only way to allocate increases, and it is not always the best fit. Knowing the alternatives helps you confirm the matrix is right for you.
The 9-box grid is worth noting because it points toward where compensation is heading. By adding potential alongside performance and pay position, it connects pay decisions to development and succession. That only works when performance, learning, and compensation data sit together, which is the same connected-data requirement that makes any merit matrix trustworthy in the first place.
Common Merit Matrix Mistakes to Avoid
- Building on uncalibrated ratings. The most common and most damaging error. Calibrate first, always.
- Using stale salary bands. Band position only means something if the band reflects current market rates.
- Skipping the budget test. Always model the matrix against your real population before committing.
- Leaving managers in the dark. A matrix that the managers do not understand becomes a matrix they override.
Bringing It Together
A merit matrix is one of the most effective tools available for making pay increases fair, consistent, and defensible. But the grid itself is the simplest part. Its value depends entirely on the quality of its two inputs: calibrated performance ratings and current salary band position.
Build the matrix carefully, test it against your real population and budget, and communicate the logic to the managers who will use it. Most importantly, treat the inputs as seriously as the grid. When ratings are calibrated and bands are current, a merit matrix corrects pay gaps while rewarding performance. When they are not, it simply distributes the existing inconsistency faster. The organizations that get this right are the ones that keep performance, compensation, and the data behind both in one connected place.


.svg)

.svg)
.svg)

